Ratio Analysis That Actually Tells You Something
This article will count 0.25 units (15 minutes) of unverifiable CPD. Remember to log these units under your membership profile.
Financial ratios are easy to calculate. A spreadsheet can produce dozens of them in seconds.
The more difficult question is: what do those ratios actually tell you?
Financial ratio analysis is one of the most accessible tools accountants can use to assess profitability, liquidity, solvency, efficiency and overall financial performance. But its real value does not lie in calculating a current ratio, gross profit percentage or return on equity. It lies in interpreting the result, understanding why it changed, considering the wider business context and using that information to support better decisions.
A ratio should therefore never be the end of the analysis. It should be the beginning of a conversation.
From calculation to interpretation
Financial ratio analysis uses relationships between figures in an organisation's financial statements to help assess its performance and financial position.
That description is useful, but it does not capture the full value of the process.
The calculation is quantitative. The value comes from what happens next.
Consider a gross profit percentage of 35%. On its own, that figure tells us very little. Is 35% good? Is it poor? Has it improved? Is it sustainable?
To answer those questions, we need context.
Perhaps the margin was 30% last year. At first glance, the increase to 35% looks positive. Further investigation, however, might reveal that selling prices were increased substantially during the year. The higher prices improved the margin, but also caused demand to fall and total sales to decline.
Suddenly, the interpretation changes.
The question is no longer simply, “Did our gross profit percentage improve?”
Management should now be asking whether the pricing strategy is appropriate, whether the business is pricing itself out of the market, how competitors are responding and whether customers understand the additional value that supposedly justifies the higher price.
The ratio identified the movement. Interpretation identified the business issue.
That distinction is fundamental to useful ratio analysis.
Different stakeholders, different questions
There is another reason that a single ratio cannot be interpreted in isolation: different stakeholders use financial information for different purposes.
A creditor or lender is particularly interested in whether the business can meet its obligations. Liquidity, solvency, cash flow and available cash reserves are therefore important. Profitability matters too, but partly because sustainable profitability supports the organisation's ability to continue operating and ultimately repay what it owes.
Management has a broader perspective. Ratios can help identify areas of over- and underperformance, operational inefficiencies, risks and opportunities. They can also provide feedback on whether previous decisions are delivering the expected results and moving the organisation closer to its strategic objectives.
Shareholders are interested in returns, but also in whether value is being created sustainably. A decision that improves a return ratio this year while weakening the business over the next five years is not necessarily value creation.
This is why the user's perspective should influence both the ratios selected and the way those ratios are interpreted.
Turn ratios into questions
Once a ratio has been calculated, the analysis should go further. For every significant movement, ask:
What changed?
Why did it change?
What does the change mean for this business?
What needs to change as a result?
Where should management focus next?
This changes the accountant's role.
Instead of simply reporting that a margin increased, debtor days deteriorated or liquidity improved, the accountant starts connecting financial results to what is actually happening inside the business.
This is where accountants become financial storytellers: not by creating a favourable story around the numbers, but by explaining what those numbers are telling management about the decisions, operations, risks and opportunities of the organisation.
Profitability: higher is not automatically better
Profitability ratios measure the organisation's ability to convert revenue into different measures of profit.
Some of the most commonly used profitability ratios are:
Gross profit margin
Gross profit margin = Gross profit ÷ Revenue × 100
This measures how much gross profit is generated from each rand of revenue after taking the direct cost of generating those sales into account.
Operating profit margin
Operating profit margin = Operating profit ÷ Revenue × 100
This provides insight into the profitability of the core operations after operating expenses have been considered.
Net profit margin
Net profit margin = Profit after tax ÷ Revenue × 100
This considers the overall profitability of the business after operating costs, finance costs, tax and other relevant items have been taken into account.
A higher profitability ratio will often indicate greater efficiency or effectiveness. But “higher is better” is too simplistic.
Suppose operating profit margin decreases materially.
The immediate reaction may be concern. But investigation could reveal a substantial increase in research and development expenditure. If that investment is part of a credible strategy to develop a new product or improve the manufacturing process, the current decline in operating profitability may support future value creation.
The decline itself is still real. What changes is its interpretation.
Management and stakeholders need to understand why profitability has fallen, what the expenditure is intended to achieve, when benefits are expected and whether the investment remains aligned with the organisation's strategy.
A ratio cannot answer those questions. It tells us where to look.
Return ratios and the danger of short-term thinking
Return ratios assess how effectively a business uses the resources available to it to generate profit.
Return on assets (ROA)
ROA = Profit after tax ÷ Average total assets × 100
ROA provides an indication of how effectively the organisation is using its asset base to generate profit.
Return on equity (ROE)
ROE = Profit after tax ÷ Average shareholders' equity × 100
ROE considers the return being generated on the capital attributable to shareholders.
Return ratios are particularly useful to investors because capital carries an opportunity cost. An investor taking additional risk by investing in a business will generally expect a return that compensates for that risk.
However, return ratios can create problematic incentives when viewed in isolation.
Imagine management is measured heavily on return on assets. One way to improve the ratio is to generate more profit from the existing asset base.
Another way is simply not to invest in the asset base.
Maintenance can be postponed. Replacement of ageing equipment can be delayed. Expansion can be cancelled. Capital expenditure can be reduced.
In the short term, the ratio may improve. Management appears to be generating a strong return from the assets employed.
But the underlying operational capacity of the business may be deteriorating.
Eventually, the organisation may face ageing infrastructure, reduced capacity, higher maintenance requirements and significant catch-up capital expenditure.
This demonstrates one of the central risks of ratio analysis: a favourable movement in a ratio does not necessarily mean that a favourable economic event has occurred.
Working capital and efficiency ratios: where profit meets cash
Efficiency ratios, sometimes referred to as activity ratios, help assess how effectively a business manages resources such as inventory, receivables and payables in its day-to-day operations.
These measures are particularly important when looking at working capital.
Inventory, debtors, creditors and cash all influence the organisation's ability to fund its operations. A profitable company can still run into serious difficulty if it cannot generate and manage cash.
Three particularly useful measures are inventory days, debtor days and creditor days.
Inventory days
Inventory days = Average inventory ÷ Cost of sales × 365
Inventory days estimate the average number of days that inventory is held before being sold.
Generally, excessive inventory days are undesirable. Holding inventory costs money and increases exposure to theft, damage and obsolescence.
But the appropriate inventory level is highly dependent on the business and its industry.
A fast-moving retailer will have a very different inventory cycle from a company selling specialised equipment. Comparing the two without considering their operating models would provide little useful insight.
Debtor days
Debtor days = Average trade receivables ÷ Credit sales × 365
Debtor days estimate the average time customers take to pay the business.
Where credit sales are not separately available, total revenue is sometimes used as an approximation, but this should be applied consistently and understood when interpreting the result.
It may seem logical that debtor days should always be as low as possible. In practice, the decision is more complicated.
Offering customers longer payment terms can stimulate demand. A customer may prefer purchasing from a supplier that allows payment in 30 or 45 days because that credit effectively helps finance the customer's own working-capital cycle.
Relaxing a credit policy can therefore increase revenue.
But it comes at a cost.
More cash becomes tied up in receivables, collection costs may increase and the risk of bad debts rises. The longer customers take to pay, the greater the exposure to customers who may ultimately be unable to settle their accounts.
The objective is therefore not simply to minimise debtor days. It is to find an appropriate balance between supporting sales and controlling the cost and risk of extending credit.
Creditor days
Creditor days = Average trade payables ÷ Credit purchases × 365
Creditor days estimate how long the business takes, on average, to pay its suppliers.
Where credit purchases are not readily available, an appropriate consistent approximation may need to be used, with the limitation recognised in the analysis.
Trade credit can be one of the least expensive sources of short-term finance available to a business. Taking advantage of agreed payment terms can therefore support cash-flow management.
But stretching suppliers beyond those terms can introduce new costs.
Interest or penalties may arise. Suppliers may change their terms, refuse further credit or stop supplying the business altogether. Important commercial relationships may deteriorate and the organisation could ultimately experience supply-chain disruption.
Effective working-capital management therefore requires optimisation rather than simply maximising or minimising individual ratios.
Bringing it together: the cash conversion cycle
Cash conversion cycle = Inventory days + Debtor days − Creditor days
The cash conversion cycle estimates how long cash is tied up in the operating cycle before being converted back into cash collected from customers.
A change in this measure can therefore be particularly useful when investigating pressure on cash flow.
Liquidity: look at what can actually become cash
Liquidity ratios help assess whether the organisation has sufficient short-term resources to meet its short-term obligations.
Current ratio
Current ratio = Current assets ÷ Current liabilities
The current ratio provides an indication of the extent to which current assets cover current liabilities.
Quick ratio
Quick ratio = (Current assets − Inventory) ÷ Current liabilities
The quick ratio provides a more restrictive view of liquidity by removing inventory from current assets.
The distinction matters because an asset being classified as current does not necessarily mean that it can immediately be converted into cash.
Inventory may be slow-moving or obsolete. A business could therefore appear to have a healthy current ratio because it carries a large inventory balance, while the quality and convertibility of that inventory tell a different story.
Again, industry context matters.
For a high-volume retailer with rapid inventory turnover, inventory may convert into cash very quickly. In another industry, stock may remain unsold for considerably longer.
Liquidity analysis therefore requires more than reading the current ratio. Accountants should consider the quality and convertibility of the underlying current assets.
Solvency: how is the business being financed?
While liquidity focuses primarily on short-term obligations, solvency considers the longer-term financial structure of the business.
Debt-to-equity ratio
Debt-to-equity ratio = Total debt ÷ Total equity
The ratio provides insight into the relationship between debt financing and equity financing in the organisation's capital structure.
But an apparently high debt-to-equity ratio cannot automatically be classified as poor.
A construction or capital-intensive business may naturally operate with considerably more debt than a professional services firm with relatively few capital requirements.
The useful question is therefore not:
“Is this debt-to-equity ratio high?”
It is:
“Is this level of debt appropriate for this organisation, its industry, its cash-generating ability and its risk profile?”
That is a much more useful management question.
Investment ratios have a different audience
Investment and value-related measures are generally more relevant to shareholders, investors and listed entities.
Earnings per share (EPS)
EPS = Profit attributable to ordinary shareholders ÷ Weighted average number of ordinary shares outstanding
EPS measures the earnings attributable to each ordinary share.
Dividend per share (DPS)
DPS = Ordinary dividends declared ÷ Number of ordinary shares
This shows the dividend attributable to each ordinary share.
Price-earnings ratio (P/E ratio)
P/E ratio = Market price per share ÷ Earnings per share
The P/E ratio links the market price of a share to the earnings attributable to that share and therefore incorporates market expectations and perceptions.
Measures such as economic value added and residual income go further by considering whether returns exceed the cost of the capital employed.
Many of these measures are particularly relevant to listed entities because they rely on market information or concepts such as the organisation's cost of capital.
For a private company, some measures can be difficult to apply reliably because information such as a market price per share or an accurately determined weighted average cost of capital may not be readily available.
This again reinforces the importance of selecting ratios based on the business and the stakeholder rather than producing a standard pack of calculations simply because those calculations are available.
Common mistakes that reduce the value of ratio analysis
The usefulness of ratio analysis can quickly disappear when basic interpretation principles are ignored.
Analysing ratios in isolation. A ratio needs a comparator. Prior periods, budgets, appropriate competitors and relevant industry information can all provide context.
Focusing on the calculation. Knowing that the gross profit margin is 35% is not analysis. Understanding why it is 35%, why it changed and what management should do about it is analysis.
Ignoring industry differences. The expected liquidity and capital structure of a mining company, retailer, construction company and professional services firm can differ substantially.
Ignoring trends. One year rarely tells the full story. A ratio that improved this year may look very different when viewed against a four-year declining trend.
Ignoring the business context. The age and maturity of the business, its strategy, ownership structure, industry and operating environment all affect the interpretation. Non-financial factors in the organisation's internal and external environment can be just as important as the number itself.
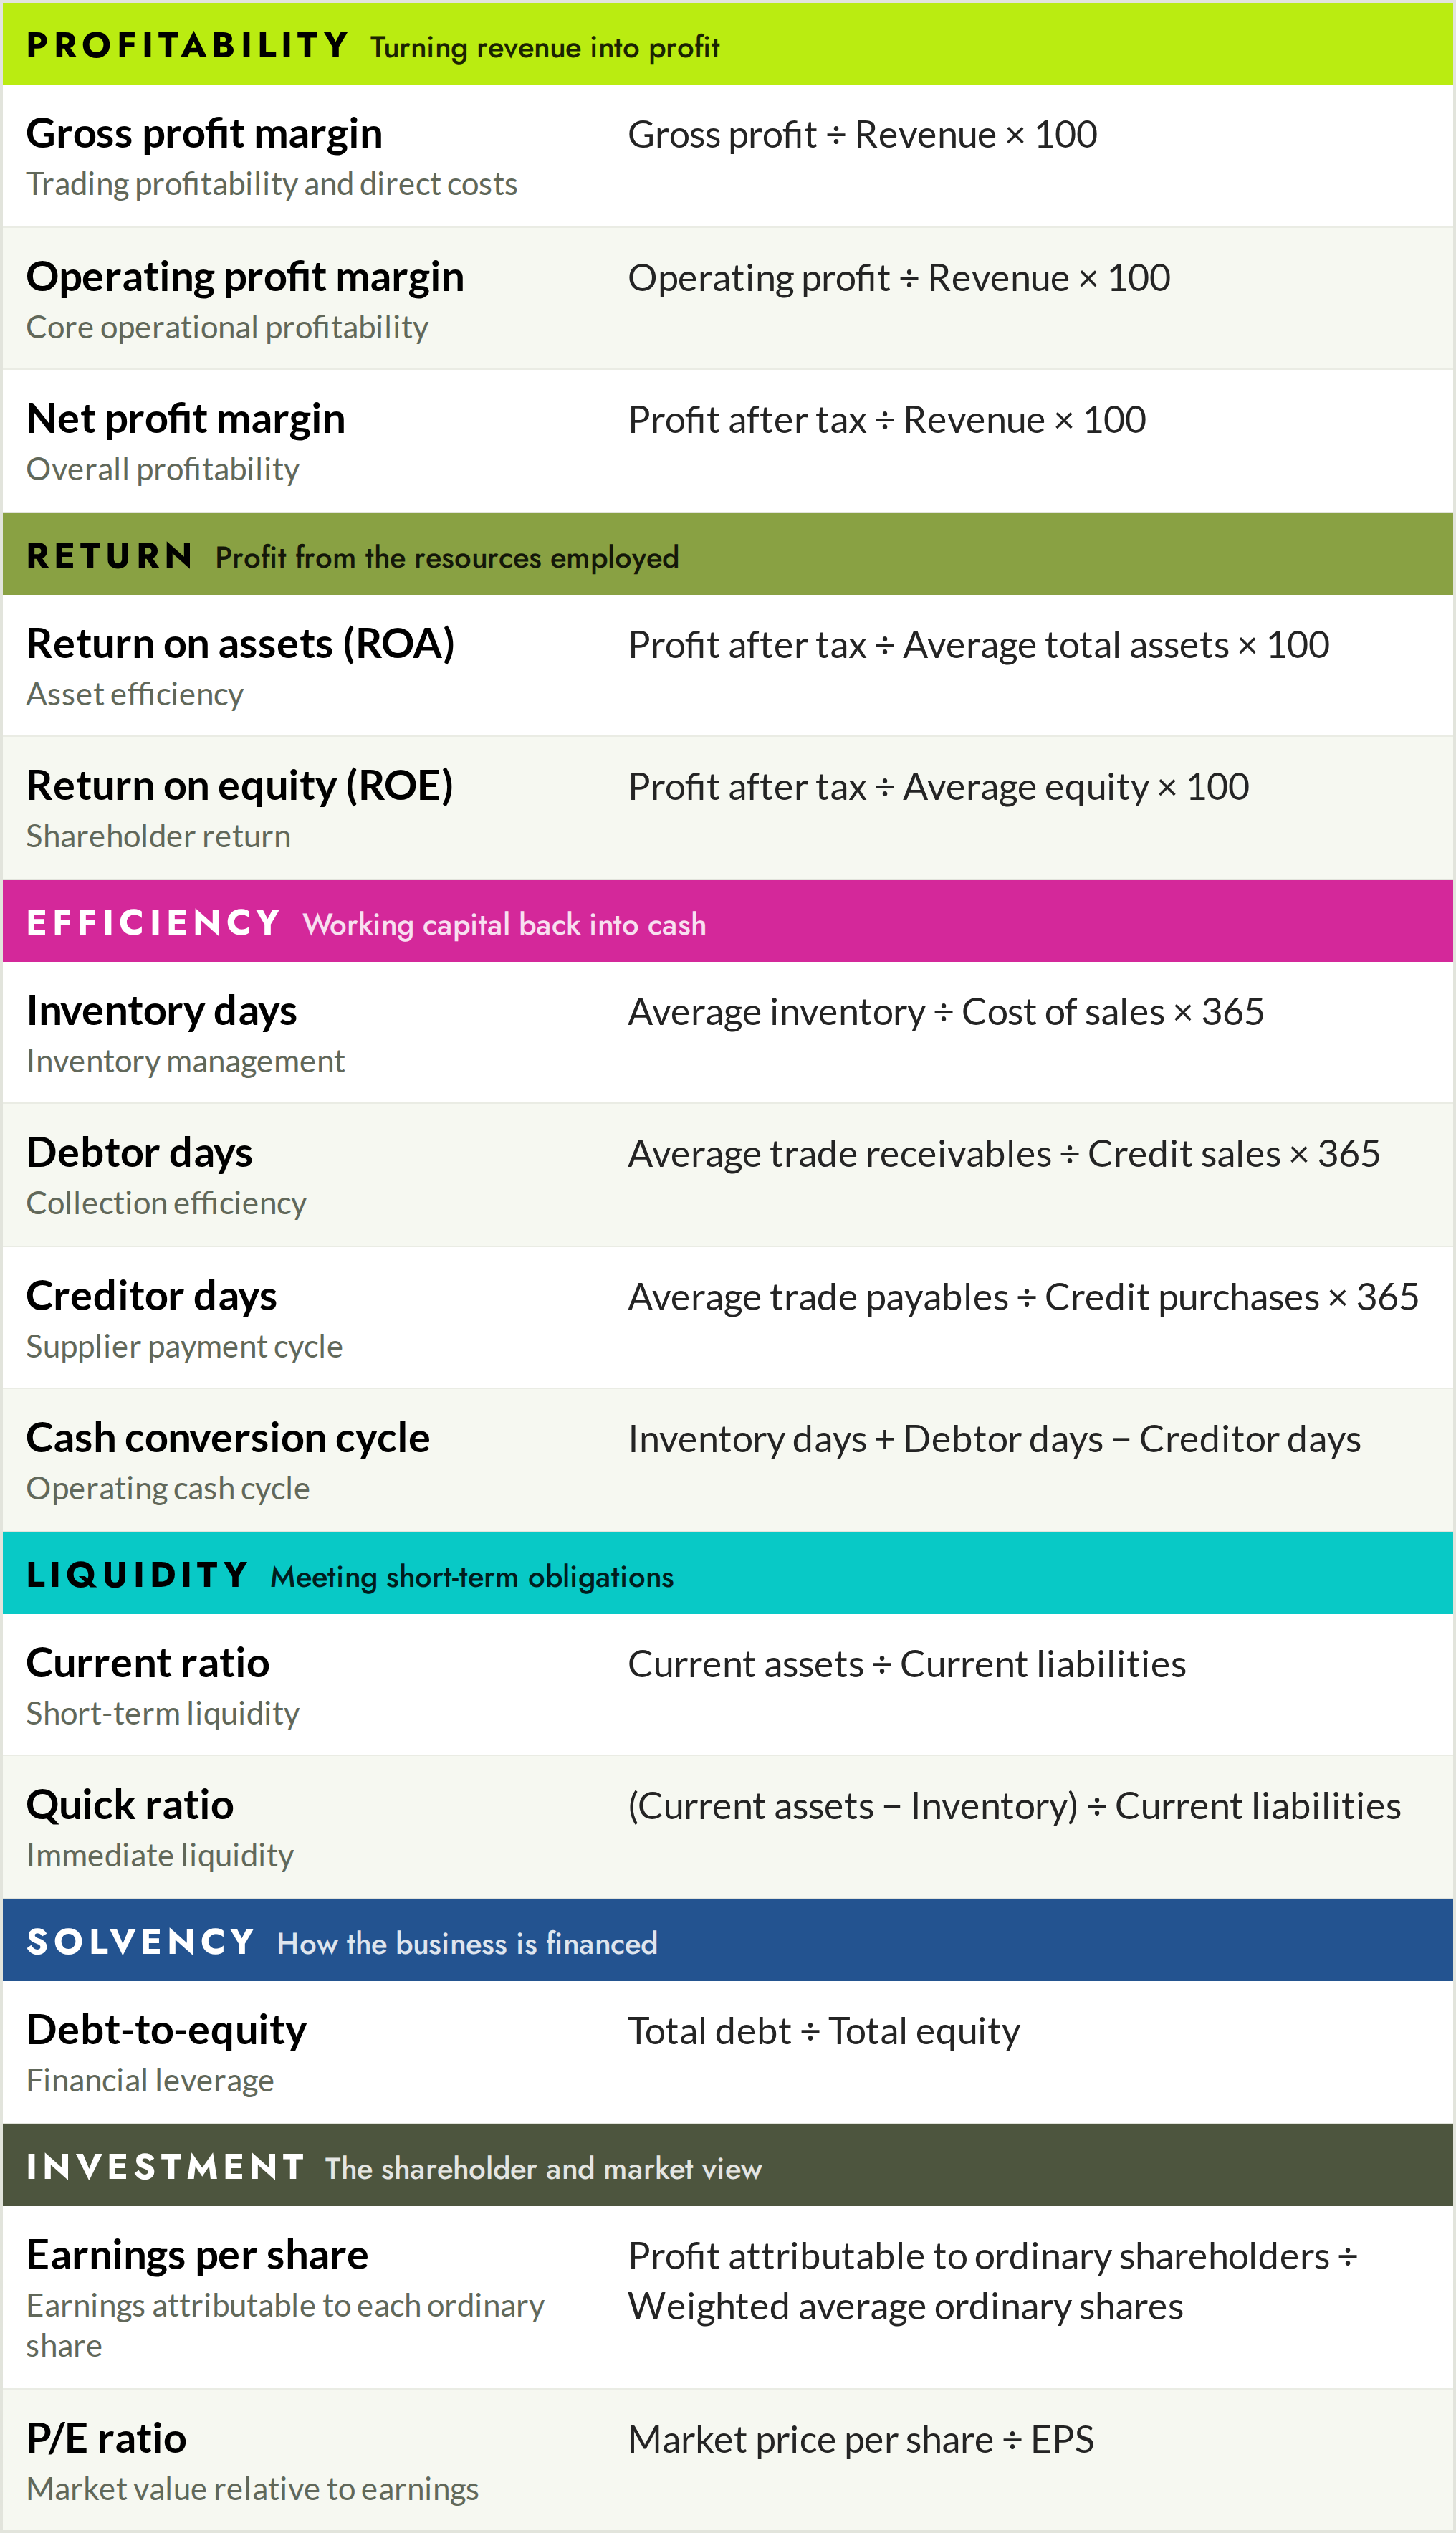
Financial ratios at a glance
The formulas are useful as a reference, but remember that the calculation is only the starting point.
Connect the dots
There is no shortage of financial information available to modern businesses. The challenge is turning that information into something useful.
For accountants, this requires moving beyond calculation.
A ratio should trigger curiosity.
What changed? Why? Is the movement consistent with our strategy? What else changed at the same time? What is happening in the market? Is this a short-term effect or part of a longer trend? What risk or opportunity does it reveal? And, most importantly, what should the business do with this information?
The objective is not to memorise more formulas or fill management reports with more percentages. It is to connect financial and non-financial information, understand the business behind the numbers and translate that understanding into better decisions.
Put it into practice
The good news is that accountants do not need to redesign their entire reporting process to make ratio analysis more useful. Whether you work in an accounting practice or within a finance department, there are practical changes you can implement immediately.
1. Select the ratios that actually matter. Choose a small group of ratios relevant to the business rather than automatically calculating every ratio available. A business experiencing cash-flow pressure, for example, may need greater focus on debtor days, creditor days, inventory turnover and liquidity.
2. Build ratios into regular reporting. Include the selected ratios in monthly or quarterly management accounts, client reports or finance dashboards. This allows trends to be identified earlier rather than waiting until year-end.
3. Always provide context. Compare the current result with previous periods, budgets or targets and, where appropriate information is available, relevant industry or competitor information. A ratio without context tells you very little.
4. Focus on material movements. You do not need to investigate every ratio every month. Identify significant or unexpected movements and ask: What changed? Why did it change? What does it mean? What needs to happen next?
5. Look beyond the accounting records. Speak to the people responsible for sales, operations, procurement, inventory and credit control. The accounting records may tell you what happened; the explanation for why it happened may sit elsewhere in the business.
6. Turn the numbers into conversations. If you are in practice, use ratio analysis to structure discussions with your clients. If you work in a finance department, use it to ask better questions of management and operational teams.
7. Turn insight into action. Where the analysis identifies a concern or opportunity, determine what needs to happen next. Agree on an action, assign responsibility and, where appropriate, establish a target. Then revisit the ratio during the next reporting cycle to determine whether the intervention is working.
Instead of simply reporting, “Debtor days increased to 52 days,” ask: “Why have debtor days increased from 35 to 52 days, and what is this doing to our cash flow?”
Instead of saying, “Gross profit margin improved,” ask: “What drove the improvement, and did it affect sales volumes or customer behaviour?”
A simple framework can help:
Measure → Compare → Question → Investigate → Act → Monitor
Ratio analysis does not need to be complicated. Start with the financial information you already have, select a handful of meaningful ratios and use them differently.
At your next management meeting or client review, don't simply present the number.
Ask what it is telling you about the business.
That is where ratio analysis moves beyond calculation and becomes a management tool — and where accountants move beyond reporting what happened to helping businesses decide what happens next.
Join Ratio Analysis That Actually Tells You Something and learn how to tell a story.
👉 Click here to register





Trending